Getting started with ztforce
This notebook walks through the core workflow: running forced PSF photometry at a fixed sky position, inspecting the resulting lightcurve, and saving it to disk.
Prerequisites: install ztforce and set your IRSA credentials (see the installation docs).
pip install ztforce
export ZTFORCE_IRSA_USER=you@example.com
export ZTFORCE_IRSA_PASS=secret
Run forced photometry
run_forced_photometry is the main entry point. Pass an RA/Dec (decimal degrees, J2000) and a list of bands. It returns a dict mapping band → Lightcurve.
[1]:
from ztforce import run_forced_photometry

# Bright star near Praesepe (M44) — PS1 g = 15.82
lcs = run_forced_photometry(
    ra=130.13113,
    dec=19.69525,
    bands=["g", "r"],
    max_epochs=50,  # cap to the 50 most recent epochs for a quick demo
)
print(lcs)
{'g': Lightcurve(ra=130.13113, dec=19.69525, n_epochs=50, bands=['g']), 'r': Lightcurve(ra=130.13113, dec=19.69525, n_epochs=50, bands=['r'])}
Inspect the lightcurve DataFrame
Each Lightcurve exposes its data as a pandas DataFrame via .df. The detection column flags epochs with SNR ≥ 3; upper_limit gives the 5σ limiting magnitude for non-detections.
[2]:
lc_g = lcs["g"]
df = lc_g.df
print(df.columns.tolist())
df[["obsjd", "mag", "mag_err", "snr", "detection", "flags"]].head(10)
['obsjd', 'band', 'flux', 'flux_err', 'mag', 'mag_err', 'zero_point', 'flags', 'snr', 'detection', 'upper_limit', 'x_fit', 'y_fit', 'image_id']
[2]:
| obsjd | mag | mag_err | snr | detection | flags | |
|---|---|---|---|---|---|---|
| 0 | 2.461005e+06 | 15.830419 | 0.006549 | 165.780296 | True | 0 |
| 1 | 2.461007e+06 | 15.907963 | 0.008592 | 126.368260 | True | 0 |
| 2 | 2.461009e+06 | 15.931780 | 0.006054 | 179.356536 | True | 0 |
| 3 | 2.461011e+06 | 15.755216 | 0.005361 | 202.525271 | True | 0 |
| 4 | 2.461016e+06 | 15.505768 | 0.008269 | 131.298511 | True | 0 |
| 5 | 2.461021e+06 | 15.773417 | 0.008637 | 125.709012 | True | 0 |
| 6 | 2.461023e+06 | 15.624690 | 0.005705 | 190.324991 | True | 0 |
| 7 | 2.461026e+06 | 15.707904 | 0.005504 | 197.265814 | True | 0 |
| 8 | 2.461028e+06 | 16.066174 | 0.006375 | 170.312528 | True | 0 |
| 9 | 2.461030e+06 | 15.945395 | 0.005522 | 196.633149 | True | 0 |
Plot
Use the .df property to access the underlying DataFrame and plot with matplotlib directly. The detection column flags epochs with SNR ≥ 3; upper_limit gives the 5σ limiting magnitude for non-detections.
[3]:
import matplotlib.pyplot as plt
import numpy as np

BAND_COLORS = {"g": "forestgreen", "r": "lightcoral"}

fig, axes = plt.subplots(1, 2, figsize=(13, 4), sharey=True)

for ax, band in zip(axes, ["g", "r"]):
    df = lcs[band].df
    color = BAND_COLORS[band]
    det = df[df["detection"]]
    non_det = df[~df["detection"] & np.isfinite(df["upper_limit"])]

    ax.errorbar(det["obsjd"], det["mag"], yerr=det["mag_err"], fmt="o", color=color, label=f"ZTF-{band}")
    ax.errorbar(
        non_det["obsjd"], non_det["upper_limit"], yerr=0.2, uplims=True, fmt="none", color=color, alpha=0.4
    )
    ax.invert_yaxis()
    ax.set_xlabel("JD")
    ax.set_ylabel("AB magnitude")
    ax.set_title(f"ZTF {band}-band")
    ax.legend()

plt.tight_layout()
plt.show()
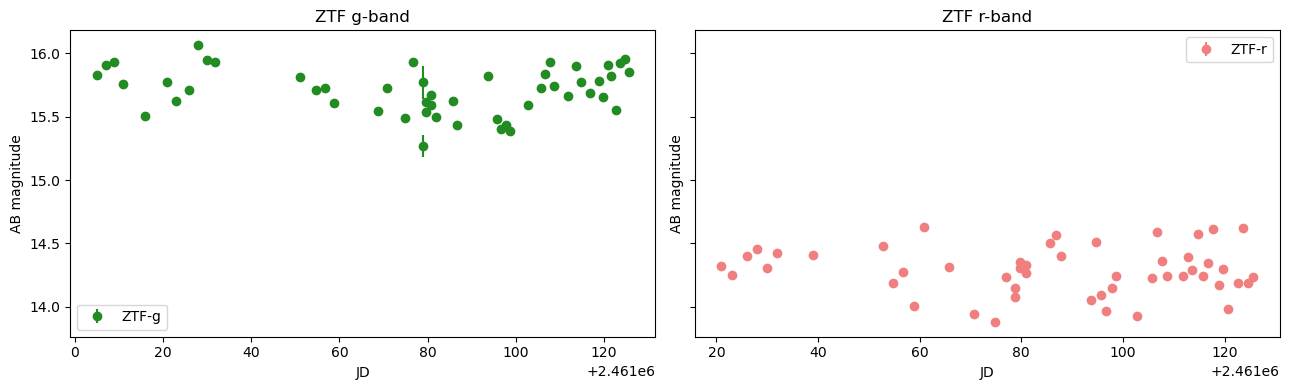
Stack detections
.stack() computes an inverse-variance-weighted (IVW) combination of all clean detections, returning a DataFrame indexed by band.
[4]:
lc_g.stack()
[4]:
| flux_stack | flux_err_stack | mag_stack | mag_err_stack | n_epochs | |
|---|---|---|---|---|---|
| band | |||||
| g | 16788.431276 | 13.713168 | 15.809848 | 0.000887 | 50 |
You can restrict the stack to a JD window, e.g. to compare pre- and post-outburst brightness:
lc_g.stack(jd_min=2460000, jd_max=2460200)
For a sliding window stack use .rolling_stack(window=30) (window in days).
Save and reload
Lightcurves are serialised as Astropy ECSV files, which preserve column types and source coordinates.
[5]:
from ztforce import Lightcurve

lc_g.save("my_source_g.ecsv")

lc_reloaded = Lightcurve.load("my_source_g.ecsv")
print(lc_reloaded)
Lightcurve(ra=130.13113, dec=19.69525, n_epochs=50, bands=['g'])
Batch mode
To run on many targets at once, pass a list of SkyCoord objects to run_forced_photometry_batch:
FITS cutouts are shared automatically when multiple targets fall on the same image.
[6]:
from astropy.coordinates import SkyCoord
from ztforce import run_forced_photometry_batch
[ ]:
targets = SkyCoord(ra=[130.13, 210.08, 130.086221], dec=[19.70, -6.88, 19.735330], unit="deg")
results = run_forced_photometry_batch(targets, bands=["g", "r"])
results
[{'g': Lightcurve(ra=130.13000, dec=19.70000, n_epochs=565, bands=['g']),
  'r': Lightcurve(ra=130.13000, dec=19.70000, n_epochs=1258, bands=['r'])},
 {'g': Lightcurve(ra=210.08000, dec=-6.88000, n_epochs=329, bands=['g']),
  'r': Lightcurve(ra=210.08000, dec=-6.88000, n_epochs=557, bands=['r'])},
 {'g': Lightcurve(ra=130.08622, dec=19.73533, n_epochs=565, bands=['g']),
  'r': Lightcurve(ra=130.08622, dec=19.73533, n_epochs=1258, bands=['r'])}]
[ ]: